


Raw data is useless on its own. Every day, the world generates 328 million terabytes of new data. Most of it is never used. Why? Because organizations lack a structured process to turn data into insight.
The data analytics process is a structure. It is a repeatable, step-by-step framework. It transforms raw numbers into clear, actionable decisions. Companies that follow it make smarter choices. They move faster. And they are 5% more productive and 6% more profitable than those that rely on guesswork.
This guide walks through all seven steps. It includes real examples, best practices, and tools for each phase. For a broader understanding, see our guide to types of data analytics and the best AI data analytics tools available in 2025.
The 7-Step Data Analytics Process
Overview: The 7 Steps at a Glance
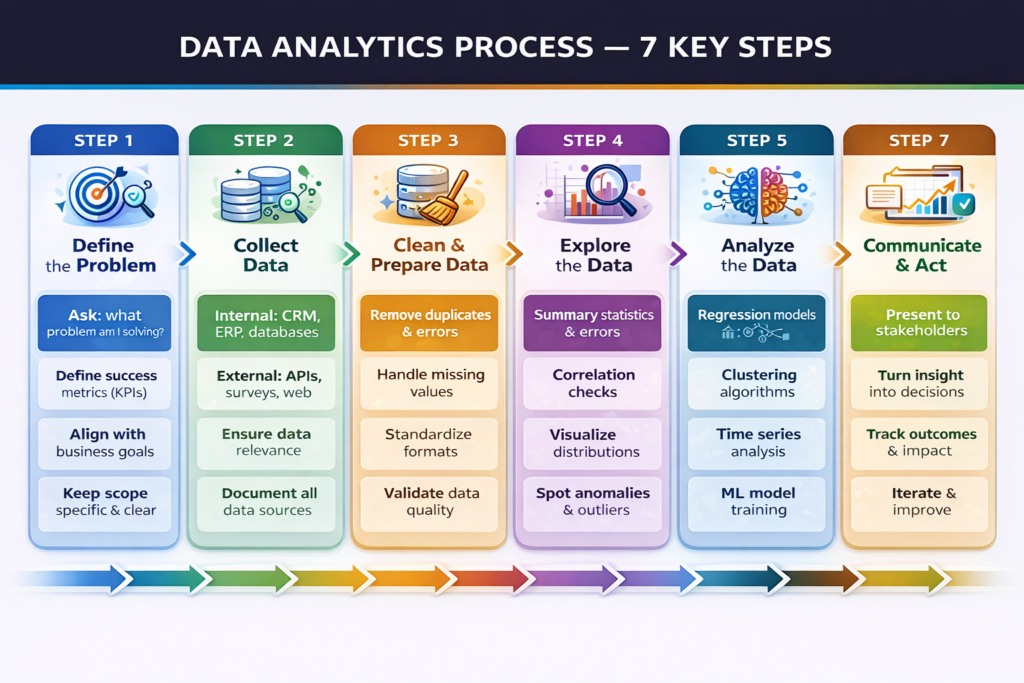
Here is the full process in summary. Each step is covered in detail below.
| Step | Phase | Key Question | Core Activity |
| 1 | Define the Problem | What are we trying to solve? | Set goals, KPIs, and success criteria |
| 2 | Collect Data | What data do we need? | Gather internal and external data sources |
| 3 | Clean & Prepare Data | Is the data reliable? | Remove errors, duplicates, missing values |
| 4 | Explore the Data | What patterns exist? | EDA summary stats, distributions, correlations |
| 5 | Analyze the Data | What does the data tell us? | Apply statistical models and ML algorithms |
| 6 | Visualize & Interpret | How do we communicate this? | Build dashboards, charts, and plain narratives |
| 7 | Communicate & Act | What should we do? | Remove errors, duplicates, and missing values |
Step 1: Define the Problem
Every great analysis starts with a great question. This is the most important step. Get it wrong, and everything that follows is wasted. Define the exact business problem you are solving. Make it specific. Make it measurable.
- Bad question: “Why are we losing customers?”
- Good question: “What is the 90-day churn rate for users who skipped onboarding in Q2?”
The second question has a clear scope. It can be answered with data. It connects to a decision.
What to Do in This Step:
- Identify the business problem or opportunity.
- Frame it as a specific, answerable question.
- Define success metrics (KPIs) before analysis starts.
- Align with stakeholders on what a good answer looks like.
- Set a clear scope of what is included and what is not.
Tip: Spend more time here than you think you need. A poorly defined question leads to accurate answers to the wrong problem, one of the most common and costly mistakes in analytics.
Step 2: Collect Data
Once you know what question you are answering, find the data to answer it. Data comes from two main sources: internal and external. Most organizations begin with what they already have.
Data Collection Sources & Types
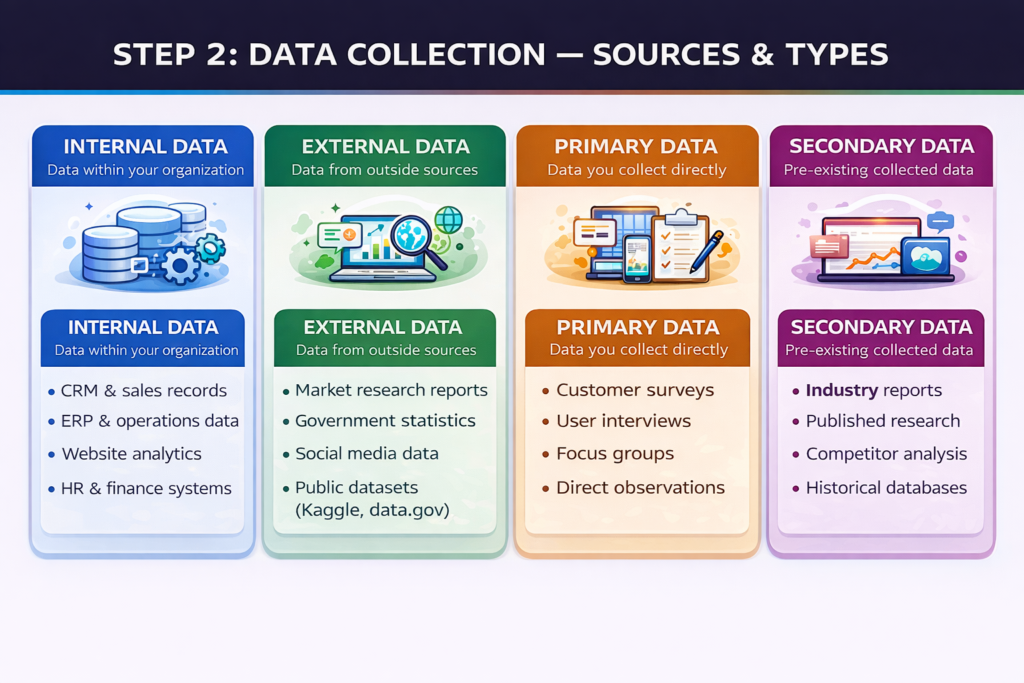
Internal Data Sources:
- CRM systems manage customer interactions, deals, and the pipeline.
- ERP platforms operate, manage inventory, and handle finance.
- Website analytics traffic, behavior, and conversions.
- HR and payroll systems workforce performance data.
External Data Sources:
- Market research reports and industry benchmarks.
- Government statistics and public datasets.
- Social media listening and sentiment data.
- Competitor data and third-party providers.
Best practice: Document the source, format, and update frequency of every dataset before you begin cleaning. This saves hours of confusion later in the process.
Step 3: Clean and Prepare Data
Raw data is almost always messy. It is never analysis-ready straight from the source. This step is unglamorous. But it is critical. Bad data produces bad insights.
Data professionals spend 60–80% of their time on cleaning and preparation. It is the heaviest part of the process. Do not rush it.
Data Cleaning Checklist
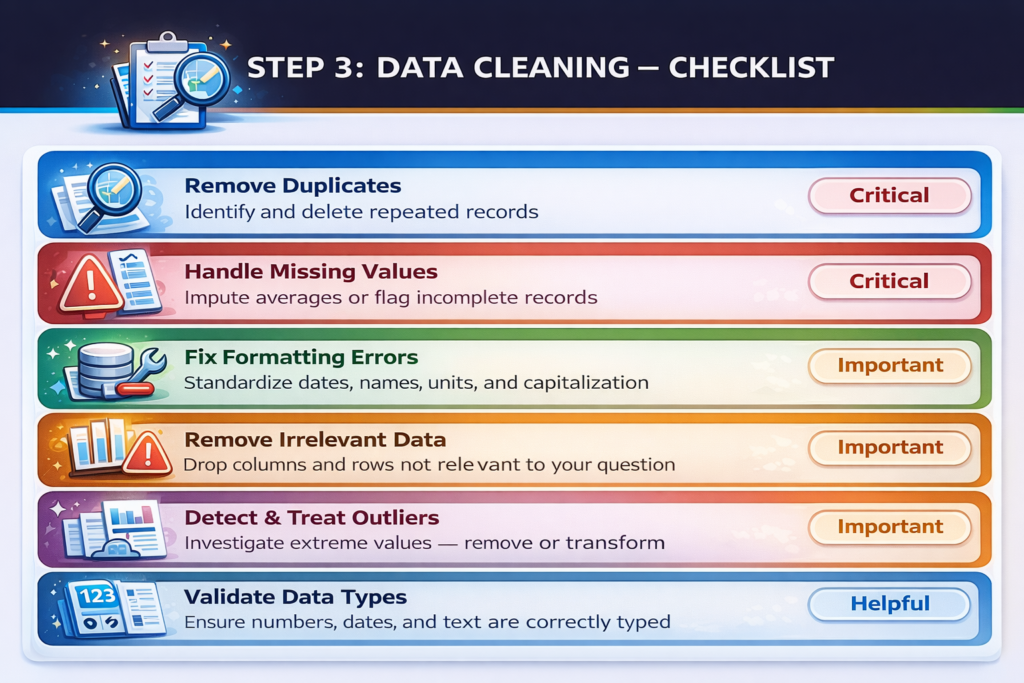
Key Cleaning Tasks:
Remove duplicates repeated records skews every analysis.
- Handle missing values, impute averages, flag gaps, or remove incomplete rows.
- Fix formatting, standardize dates, names, units, and capitalization.
- Remove irrelevant data, drop columns and rows outside your scope.
- Detect outliers, extreme values may reflect real events or data errors.
- Validate data types, ensure numbers, dates, and text are correctly classified.
- Normalize or scale to prepare numerical data for statistical models.
- Document all changes and maintain a log of every transformation for reproducibility.
Tools like Python (pandas), SQL, and platforms like KNIME and Trifacta automate much of this work. But human judgment is still required for edge cases.
Step 4: Explore the Data (EDA)
Exploratory data analysis (EDA) is where analysis truly begins. You examine the clean data to understand its structure. You look for patterns, trends, relationships, and anomalies.
This step is deliberately open-ended. You are not yet testing a hypothesis. You are forming one.Think of EDA as getting to know your data before you interrogate it.
EDA Techniques
- Summary Statistics: Mean, median, mode, standard deviation.
- Frequency Distributions: How often do different values appear?
- Correlation Analysis: Which variables move together?
- Data Visualizations: Histograms, scatter plots, box plots.
- Segmentation: How do different customer groups behave?
- Anomaly detection: Are there unexpected spikes, drops, or gaps?
Key insight: EDA often reveals that the original question needs to be refined. That is normal. The best analysts treat EDA as a dialogue with the data, not just a technical task.
Step 5: Analyze the Data
This is the core of the data analytics process. You apply the right technique to answer your question. The technique you choose depends on your question type. Different questions need different methods.
Analysis Techniques at a Glance
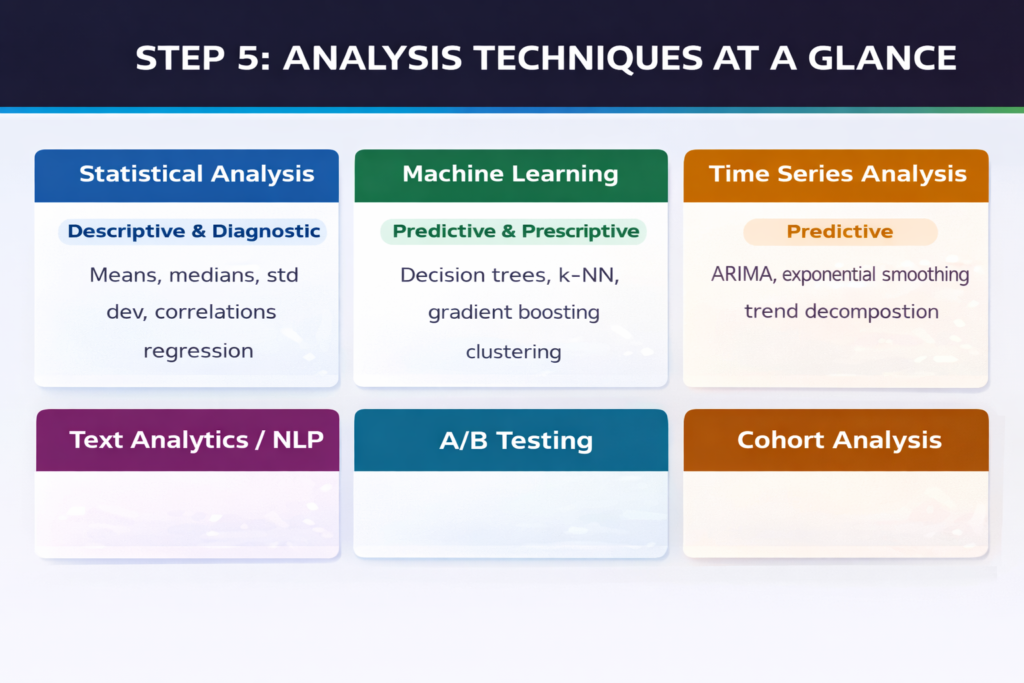
Choosing Your Technique
- Descriptive questions → summary statistics, dashboards, frequency tables.
- Diagnostic questions → correlation, drill-down analysis, root cause investigation.
- Predictive questions → regression, decision trees, neural networks, time series.
- Prescriptive questions → optimization algorithms, Monte Carlo simulation, AI models.
Modern platforms like IBM Watson Studio, Databricks, and Julius AI accelerate this step with built-in model libraries and AutoML features.
Use the right model for your data type. Categorical data needs different treatment from continuous numerical data. Always split data into training and testing sets when building predictive models. This prevents overfitting.
Step 6: Visualize and Interpret
Analysis produces results. Visualization makes results understandable.
Numbers in a spreadsheet do not drive decisions. Clear charts and dashboards do. The goal of this step is clarity, not complexity. Your audience includes non-technical decision-makers. Speak their language.
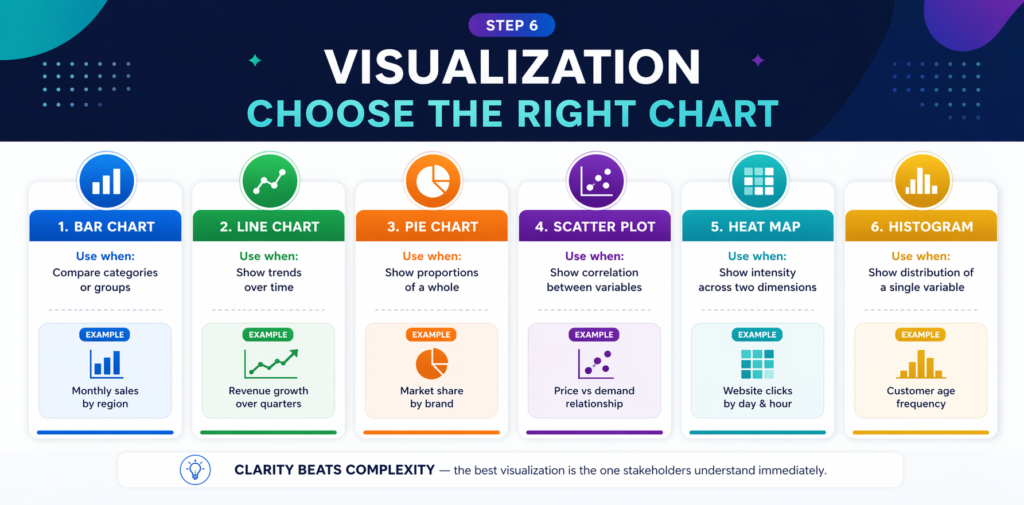
Visualization: Choosing the Right Chart
Visualization Best Practices
- Use bar charts to compare values across categories.
- Use line charts to show trends over time.
- Use scatter plots to show correlations between two variables.
- Use pie charts sparingly, only for simple part-to-whole comparisons.
- Keep colors meaningful and consistent throughout a report.
- Label clearly every axis, legend, and data point should be self-explanatory.
- Lead with the key finding; do not bury the headline.
Tools like Tableau, Power BI, and Google Looker Studio excel at this step. Many now include AI-powered natural language narration that turns chart data into written summaries automatically.
Step 7: Communicate Insights and Drive Action
Insight without action is just information. This step bridges the gap between analysis and decision-making. Your job is not finished when the charts are built. It is finished when the business acts.
Communicating Effectively
- Tailor the message to your audience. Executives need strategy, operators need detail.
- Lead with the recommendation, then support it with data.
- Anticipate objections and address them in your presentation before they are raised.
- Use plain language. Avoid jargon. If your audience needs a dictionary, you have lost them.
- Document your methodology other analysts should be able to reproduce your work.
Driving Action
- Link every insight to a specific business decision or next step.
- Define who is responsible for acting on each recommendation.
- Set a timeline for implementation and outcome measurement.
- Schedule a follow-up review to assess whether the action produced the expected result.
The data analytics process is iterative. After action is taken, new data is generated. New questions emerge. The cycle begins again. This is how organizations become data-driven, not through a single project, but through a culture of continuous analytical improvement.
Insight: 63% of companies using structured data analytics frameworks report significant productivity gains. The process itself is a competitive advantage not just the technology.
Frequently Asked Questions (FAQs)
Common questions about the data analytics process answered clearly.
Q: What is the data analytics process?
A: The data analytics process is a structured, step-by-step framework for turning raw data into actionable business insights. It typically involves seven phases: defining the problem, collecting data, cleaning and preparing data, exploring the data, analyzing it, visualizing and interpreting results, and communicating insights to drive decisions. Following this process ensures that analysis is focused, reproducible, and genuinely useful.
Q: How many steps are in the data analytics process?
A: Most frameworks describe six to seven steps. The core phases are always the same: define the question, collect data, clean data, explore, analyze, visualize, and communicate. Some frameworks merge visualization and communication into a single step. Others add an iteration or feedback step at the end. The number matters less than the discipline of following the process consistently.
Q: What is the most time-consuming step in data analytics?
A: Data cleaning and preparation is universally the most time-consuming step, consuming 60–80% of a data analyst’s total project time, according to industry surveys. Raw data from multiple sources is almost always messy, incomplete, and inconsistently formatted. Investing properly in this step is essential: poor data quality undermines every subsequent stage of the process.
Q: What tools are used in the data analytics process?
A: Different tools serve different steps. This data collection: SQL databases, APIs, and web scraping tools. For data cleaning: Python (pandas), R, and tools like Trifacta or KNIME. For exploration and analysis: Jupyter Notebooks, Python, and R.
This visualization: Tableau, Power BI, and Google Looker Studio. For communication: PowerPoint, Notion, and interactive dashboards. AI-powered platforms like Julius AI and IBM Watson Studio automate steps across the entire process.
Q: How is the data analytics process different from the data science process?
A: The data analytics process focuses on answering specific, predefined business questions using structured data. It produces reports, dashboards, and insights. The data science process is broader, it includes building new algorithms, training machine learning models, and deploying automated AI systems. Data analytics answers what and why. Data science also builds the systems that predict and automate.
Q: Can small businesses use the data analytics process?
A: Absolutely. The data analytics process scales to any organization size. A small business tracking sales through a spreadsheet is performing descriptive analytics. Adding Google Analytics for website behavior involves data collection and exploration. Any business asking ‘why did this happen?’ or ‘what should we do next?’ is already engaged in analytics. Modern tools like Google Looker Studio and Zoho Analytics make professional-grade analytics accessible without large budgets or technical teams.
Q: How long does the data analytics process take?
A: It depends entirely on the complexity of the question and the quality of available data. A simple business dashboard for weekly KPIs might take a few hours. A predictive churn model for a major enterprise might take weeks or months. Most data professionals report that problem definition and data cleaning take far longer than the actual analysis. Strong upfront planning, clear questions, documented data sources, and defined success metrics significantly reduce total time.
Q: What is exploratory data analysis (EDA)?
A: Exploratory data analysis (EDA) is the fourth step of the process an open-ended investigation of your cleaned dataset. The goal is to understand the data’s structure, spot patterns, identify relationships between variables, and detect anomalies before applying formal statistical models. EDA uses summary statistics, visualizations (histograms, scatter plots, box plots), and correlation analysis. It often leads to refining the original question before moving into deeper analysis.
Conclusion
The data analytics process is not complicated. But it is disciplined. Skip a step, and the results suffer. Rush the cleaning phase and the insights mislead. Follow the process correctly, and it becomes a powerful, repeatable engine for better decisions.
Every step matters. Define clearly. Collect carefully. Clean thoroughly. Explore openly. Analyze rigorously. Visualize clearly. Communicate decisively. For organizations ready to invest in this framework, the returns are significant. For continued reading on AI tools transforming analytics, data science, and business intelligence, explore the full range of resources available in 2026.